Customer Support
Learn how to build a bootstrapped startup financial model from scratch. Includes a free template, real examples, and a clear framework to manage cash, reduce burn, and extend runway.

•
•

I have bootstrapped tech companies for 10 years now, selling 2 different companies, entirely self funded. Now I am building Bugtrotter with the same goal. The single biggest lesson across both: a financial model is the difference between running out of cash and hitting profitability.
Most founders build one too late. They are heads down on product then one day they look up and have six weeks of runway left with no plan. I have been close to that moment. The model is what kept me from it.
This is not theoretical. Everything in this guide is the exact framework I have used and am using currently running Bugtrotter. By the end you will have a working financial model customized to your startup in under an hour.
Here's what you will learn:
How to build a booted financial model from scratch
The 5 mistakes that kill 80% of bootstrapped startups
How to make better decisions using the same template we use at Bugtrotter
What Is Startup Booted Financial Modeling?
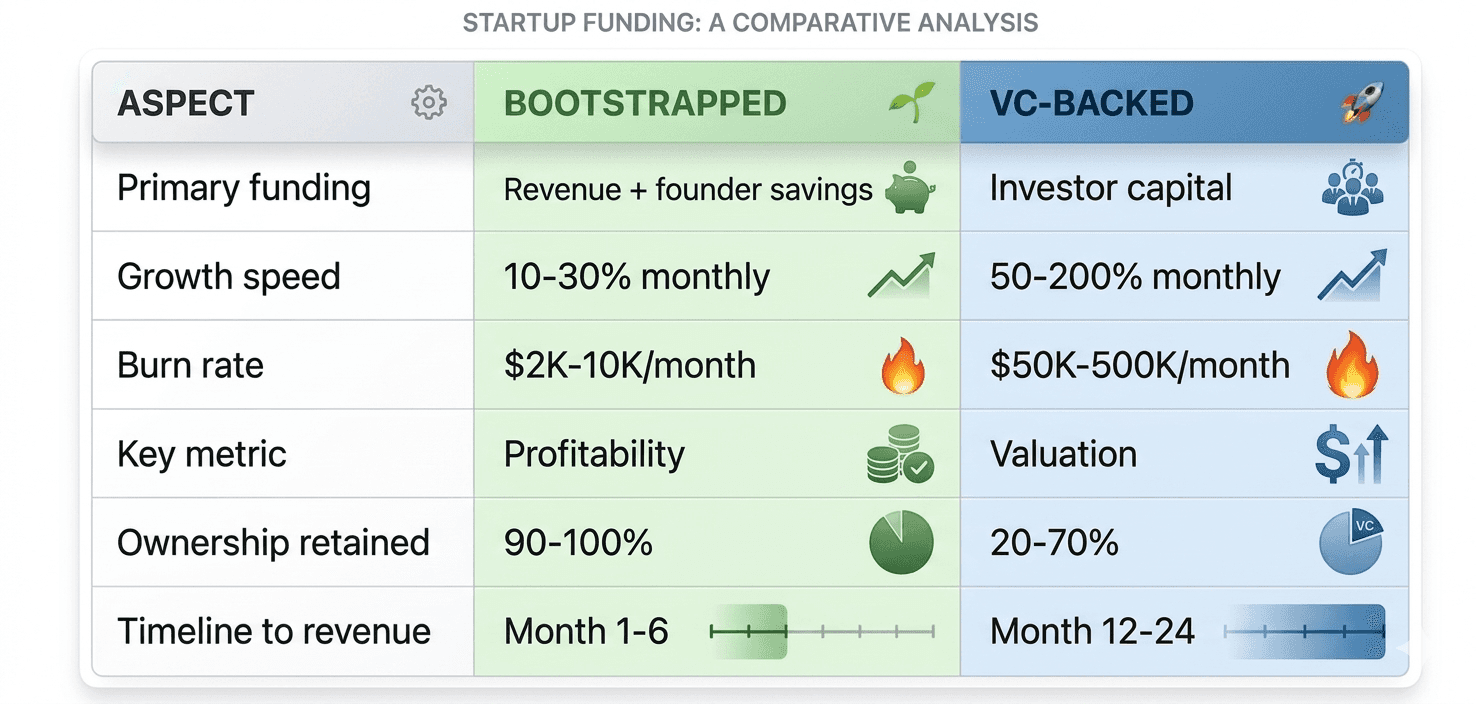
Booted financial modeling, shorthand for bootstrapped financial modeling, is the process of forecasting your startup's financial future using only internal funding and early revenue. No venture capital. No external runway handed to you by investors. Just your own money, your customer’s money and a clear picture of how long it lasts.
It differs from VC backed modeling in one fundamental way: the goal isn’t growth at all cost. The goal is survival first, profitability second and growth third. Every decision in a booted model is filtered through one question: does this extend or shorten my path to profitability?
The four principles that underpin every booted financial model:
Revenue first growth. Customer income is your fuel. Every decision is evaluated against whether it brings in more customers or retains existing ones.
Lean cost management. Overhead is the enemy. Every cost that doesn't directly contribute to revenue or product is a liability.
Founder control. You own the company. Every month you stay bootstrapped is another month you don't dilute that.
Sustainability. The goal is a profitable business and not a fundable one.
Why Startup Booted Financial Modeling Matters (With Real Examples)
The benefits of financial modeling are easy to list. Cash visibility, better decisions, investor readiness. But the real reason it matters is more specific than that.
Here are two real moments where having a model changed everything and where not having one would have been catastrophic.
Story 1: The $12K Decision
A founder told me about a decision that almost killed their company. Four months in, they were considering their first full time hire, a senior developer at $7K a month. Revenue was at $9K MRR and growing 12% monthly. The hire felt justified.
They built out the model first. It showed something they hadn't seen coming: at $7K a month their burn would jump from $5K to $12K. Even with 12% growth they would run out of cash in four months with only $16K in the bank.
They pivoted. Two mid level contractors at $3.5K total instead of one senior hire. Same capacity. Lower fixed cost. More flexibility if things went sideways.
That swap bought them eight additional months of runway. They hit $19K MRR and profitability before bringing anyone on full time.
The model saved them from a $7K monthly commitment that would have put them out of business by Month 5.
Story 2: The Pricing Change
Antonio Carlos Soares, CEO of Run Run It, built his SaaS business in Brazil on a freemium model with plans starting at just $6.50 a month for a 10 seat account. It spread fast. Word of mouth was strong. Customers loved it.
Then an advisor ran the math for him. At their ARPU of around $20, they would need 200,000 customers to hit $100M in revenue. The pricing was simply wrong for the business they wanted to build.
So they raised prices, not once but four or five times. It amounted to a 12x increase overall. Each time they raised prices for new customers, they would see a sales dip for about 15 days then conversion rates would return to normal. The market was absorbing it because the product was genuinely delivering value.
The more surprising effect was on revenue churn. As existing customers churned off old low tier plans, others were upselling onto the new higher ones. The result was negative net revenue churn, they were losing logo count but growing revenue from the remaining base.
It wasn't painless. When they raised prices on existing customers and stopped grandfathering early adopters, some felt betrayed. It was the first time people said bad things about the company publicly. But the revenue impact was significant, Antonio described it as potentially adding six months to a year of growth just by repricing the existing portfolio.
The lesson: most SaaS companies start charging too little because the product isn't deep enough yet. By the time the product is genuinely valuable, they are still anchored to launch era pricing and fixing that is uncomfortable but necessary.
Listen to the full episode on the SaaS Podcast
The Startup Booted Financial Modeling Framework (Step-by-Step)
Step 1: Define Your Revenue Model
Start with how money comes in. List every income source: subscriptions, one-time fees, add-ons, annual plans. For most early-stage SaaS companies this is straightforward.
Make your revenue model look like this:
Target: 100 customers
70% on Growth plan at $199 a month
30% on Starter plan at $99 a month
Weighted average: $139 per customer
Projected MRR: $13,900
The weighted average is the number that matters. It tells you what one customer is worth on average across your pricing tiers and it's the foundation every other calculation in the model builds on.
Action step: List your pricing tiers and estimate what percentage of customers land on each one.
Step 2: Map Your Cost Structure (Fixed vs Variable)
Every cost in your business is either fixed: it stays the same regardless of how many customers you have or variable: it scales as you grow. Knowing which is which changes how you model growth.
Here is example of a Fixed and Variable cost
Fixed costs:
Servers and infrastructure: $500
Tools (Stripe, email, analytics): $200
Founder salaries: $0 (reinvesting)
Subtotal: $700
Variable costs at 100 customers:
Video storage: $100 per 50 customers
Payment processing at 2.9% of revenue: ~$400
Customer support tools: $50 per 50 customers
Subtotal: ~$550
Total burn at 100 customers: $1,250 a month.
That number — $1,250 is what you should be working against every month. Everything in the model flows from it.
Action step: Separate every cost into fixed or variable. Be specific. Vague cost estimates are where models break down.
Step 3: Build Monthly Cash Flow Projections
Cash flow is not profit. This distinction matters more than almost anything else in bootstrapped modeling. You can be profitable on paper and out of cash in reality and out of cash means out of business regardless of what your spreadsheet says.
The formula that matters most:
Runway (months) = Current Cash ÷ Monthly Burn Rate
A simple example:
Starting cash: $10,000 founder investment
Monthly burn: $1,250
Monthly revenue at Month 3: $2,500
Net burn: -$750 (still burning but slowing)
Runway: 13.3 months
One mistake many make early on: They forget to account for seasonal trends. If summer is 40% slower because your customers included educators. The model would show profitability in Month 9. The reality was Month 11 because of two slow summer months wouldn't have been modeled.
Action step: Project cash flow for the next 12 months. Include seasonal patterns even if you are guessing. A wrong assumption you have thought about is better than one you have ignored.
Step 4: Calculate Your Break-Even Point
Break even is the moment revenue equals costs. For a bootstrapped startup it's the most important milestone on the calendar, the moment the business can sustain itself without founder capital.
Here is a example of this:
Fixed costs: $700 a month
Variable costs at break-even: ~$300
Total costs: $1,000 a month
Revenue needed to break even: $1,000
Customers needed: 10-15 depending on plan mix
Target: Month 2-3
Ten to fifteen customers. That's a real number you can build a plan around. Abstract profitability goals don't create urgency. A specific customer count with a specific month attached does.
Action step: Calculate exactly how many customers you need to break even. Put that number somewhere you see it every day.
Step 5: Model Key SaaS Metrics
Five metrics that belong in every booted financial model:
MRR (Monthly Recurring Revenue) Formula: Active customers × Average revenue per customer Company X: 100 × $139 = $13,900
Churn Rate Formula: Lost customers ÷ Starting customers Target: Under 5% monthly for early-stage SaaS Company X assumption: 5%
CAC (Customer Acquisition Cost) Formula: Total marketing spend ÷ New customers acquired Company X: $500 marketing ÷ 10 new customers = $50 CAC
LTV (Lifetime Value) Formula: ARPU ÷ Churn rate Company X: $139 ÷ 0.05 = $2,780
LTV:CAC Ratio Formula: LTV ÷ CAC Company X: $2,780 ÷ $50 = 55.6:1 Target: Over 3:1 is good. Over 10:1 is excellent.
Company X LTV:CAC of 55:1 told us our $500 a month marketing spend was working well enough that we could afford to increase it significantly. That's a decision the model made not a hunch.
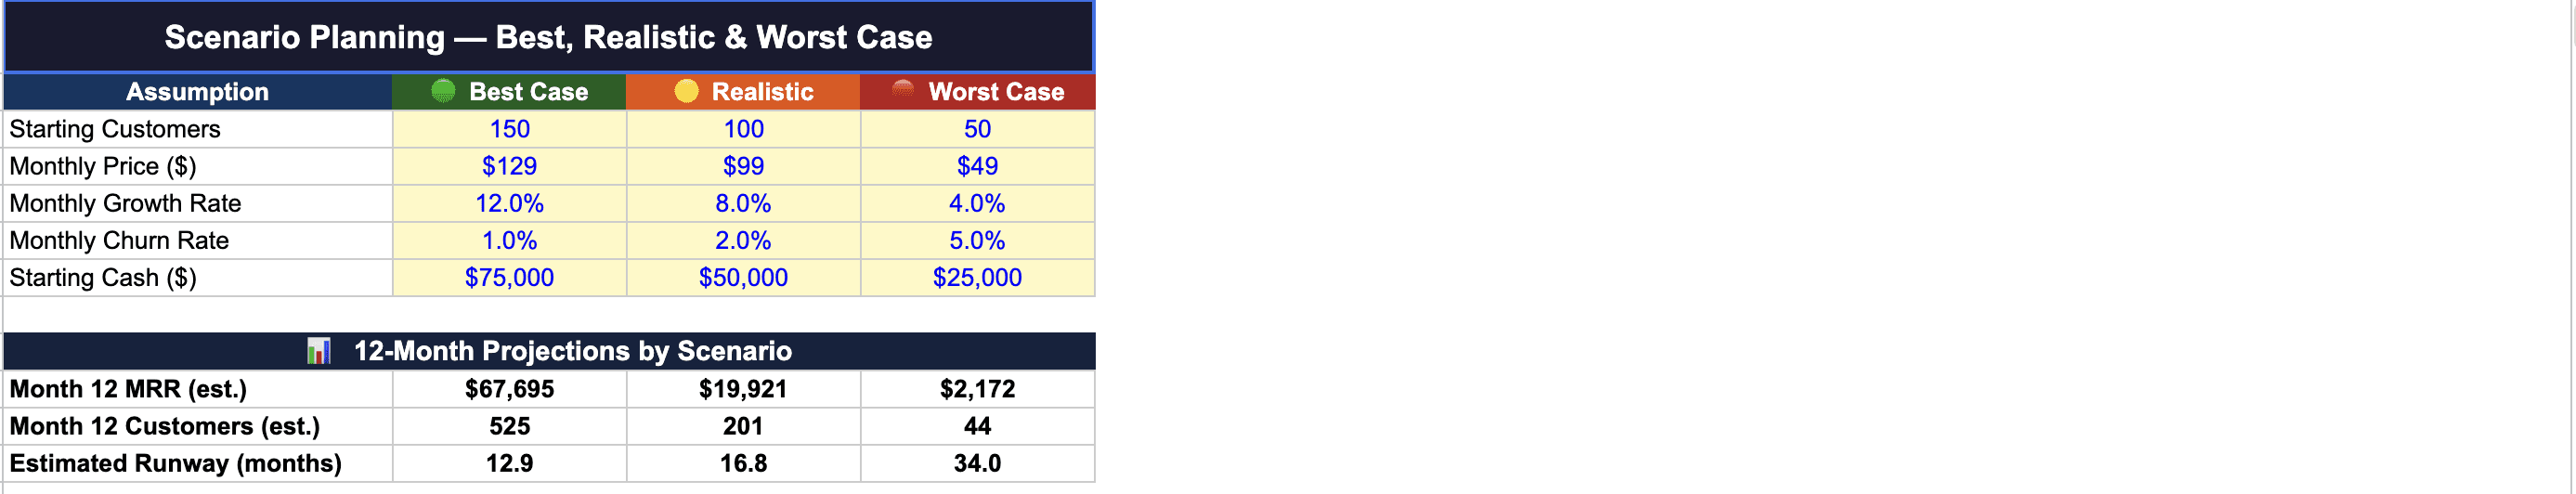
Step 6: Plan Scenarios and Iterate Monthly
Never run one projection. Run three.
Scenario | Growth Rate | Month 12 MRR | Customers | Decision |
|---|---|---|---|---|
Best | 20%/month | $18,500 | 133 | Hire full-time dev |
Realistic | 12%/month | $11,200 | 80 | Hit target, stay lean |
Worst | 5%/month | $6,800 | 49 | Cut costs, extend runway |
We budget for realistic, hope for best and prepare for worst. Every month we update all three based on actual performance. The scenarios stop being theoretical around Month 4 when you have enough real data to anchor your assumptions.
Action step: Build all three scenarios before you need them. The worst case scenario should inform every major decision.
Download the Free Financial Model Template
This is the exact spreadsheet we use to run Bugtrotter. The confidential numbers are stripped out and instructions are added so you can fill in yours in under an hour.
This template helped us decide to raise prices from $49 to $99, choose contractors over full-time hires and hit profitability in Month 11. Here's what's inside:
Tab 1: Instructions: How to use the template, key formulas explained and common mistakes to avoid.
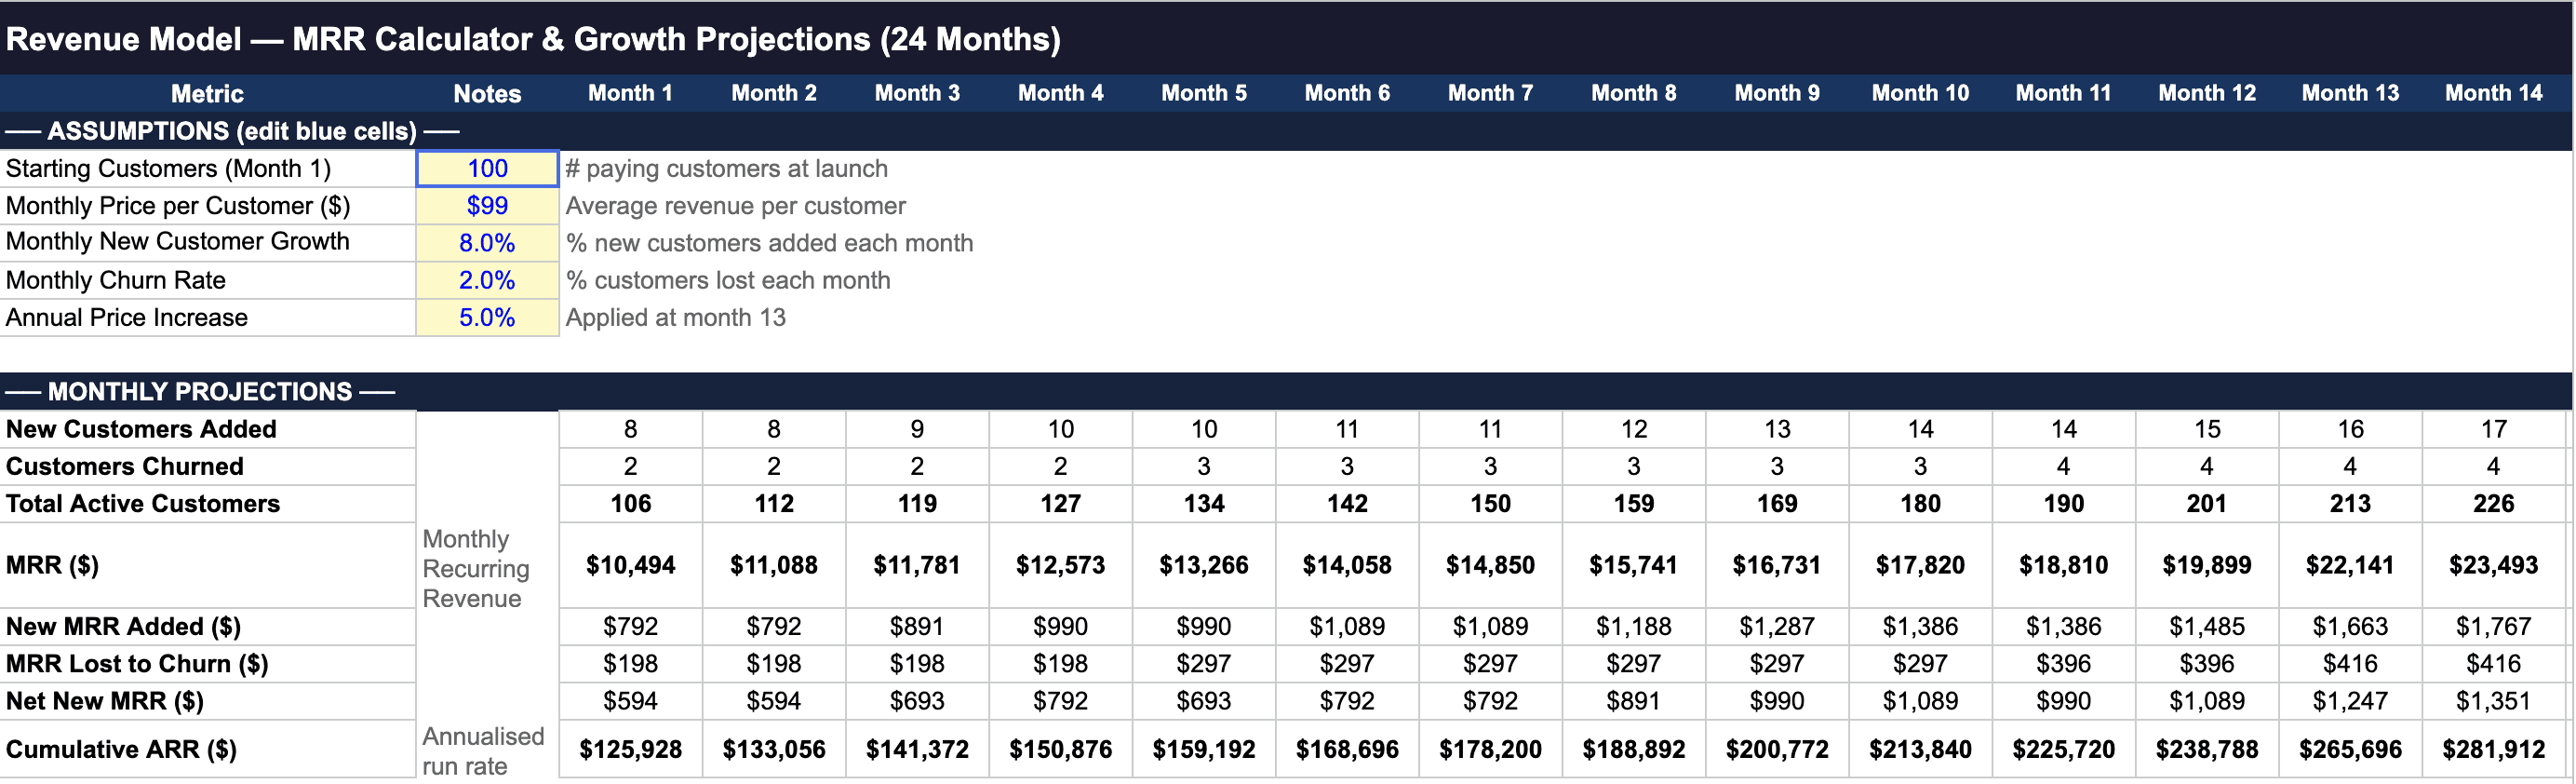
Tab 2: Revenue Model: MRR calculator with growth projections, churn impact modeling and customer acquisition forecasts. Pre-filled with a SaaS example at 100 customers and $99 a month.
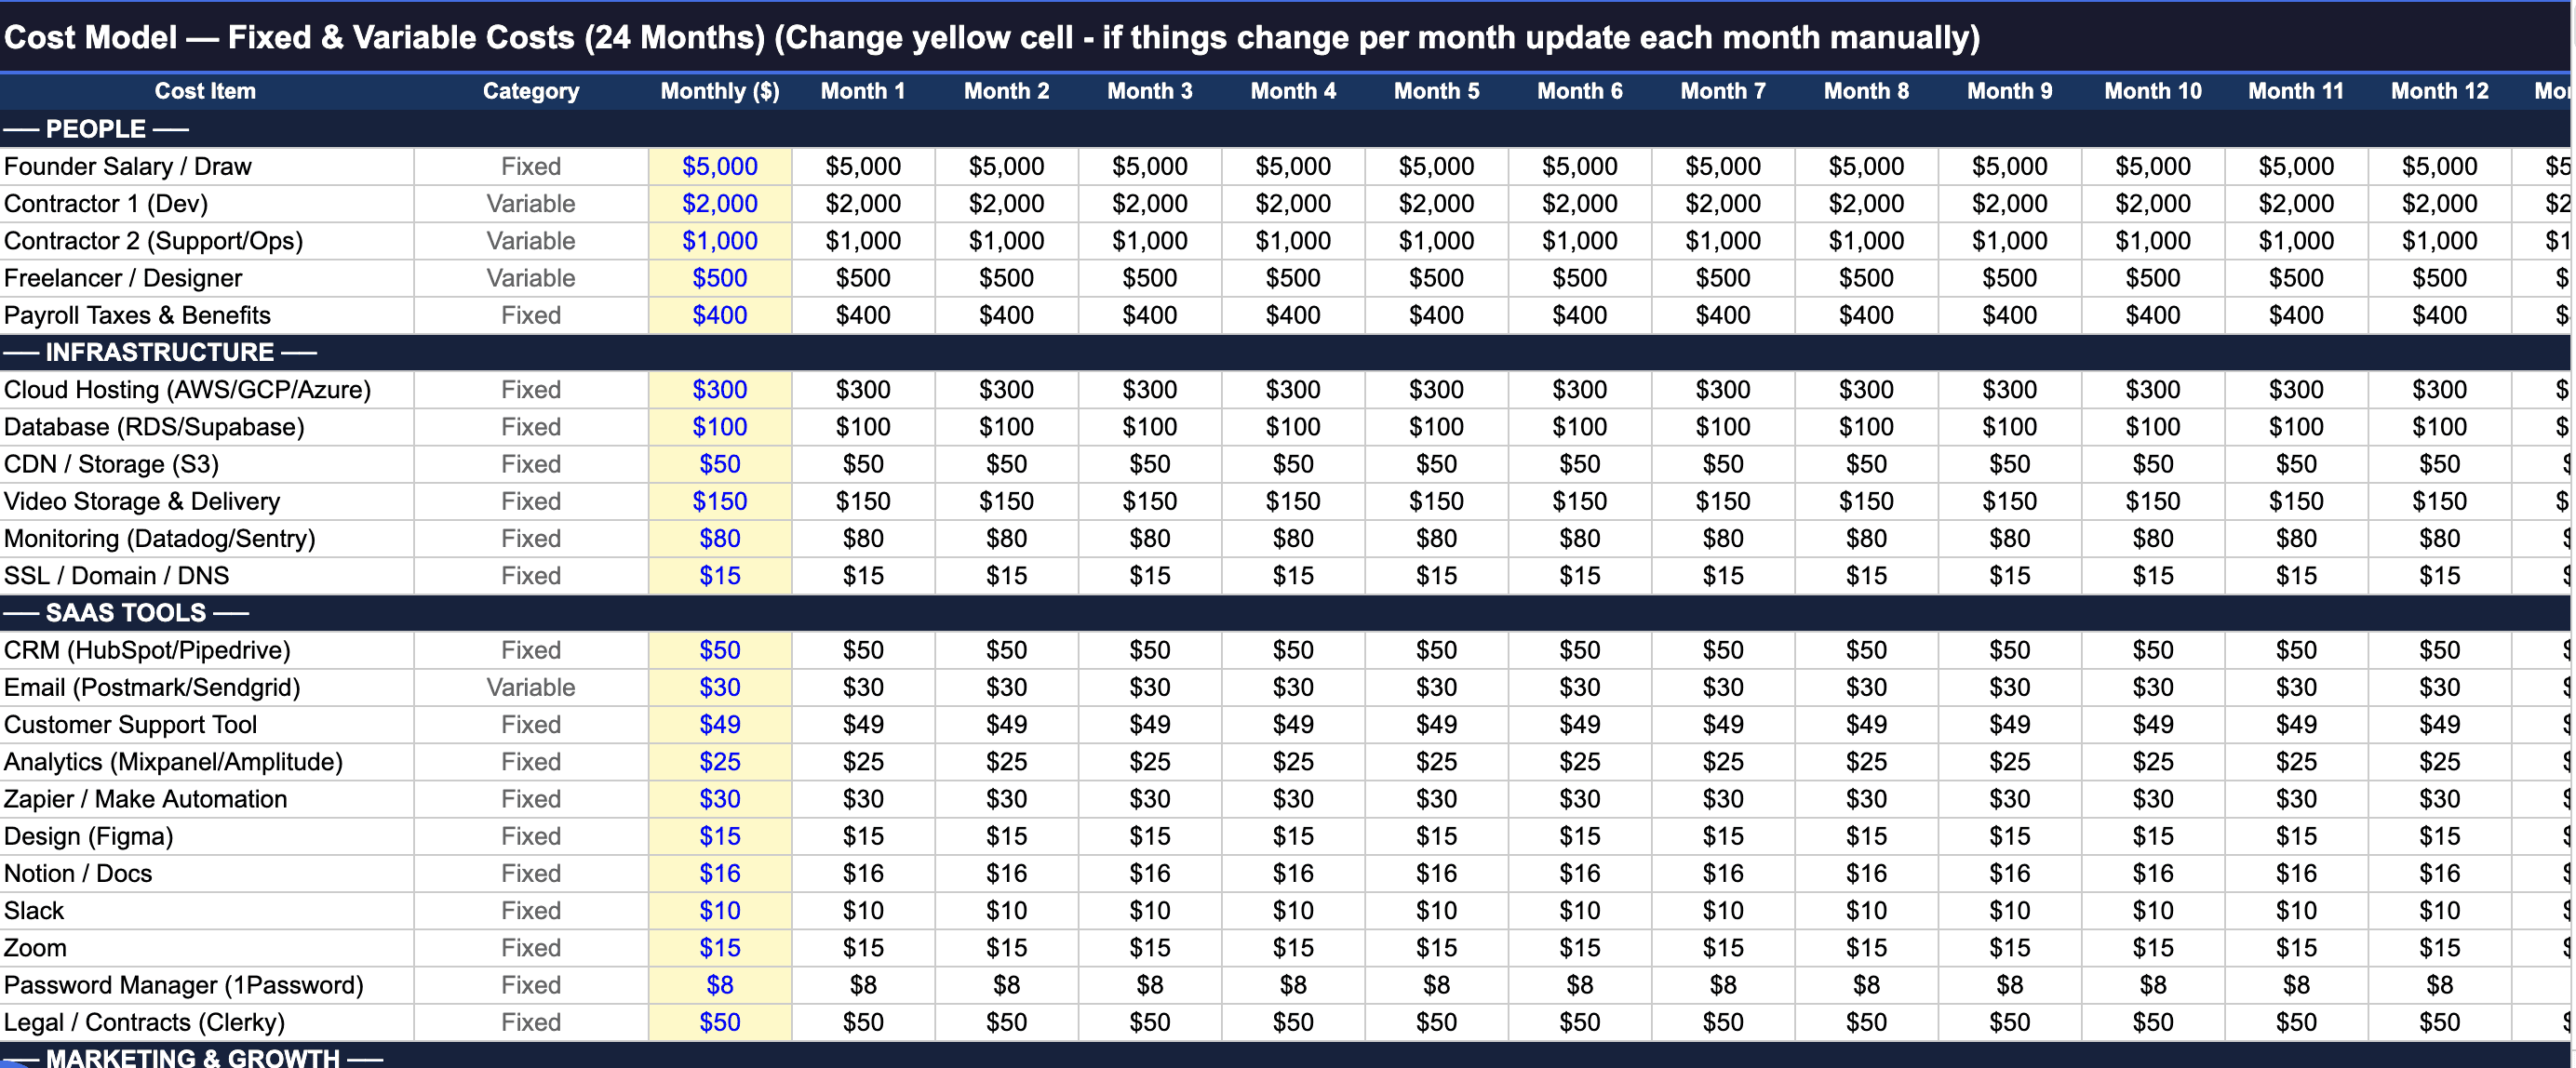
Tab 3: Cost Model: Fixed and variable costs with 50+ line items you can customize. Pre-filled with a typical SaaS cost structure.
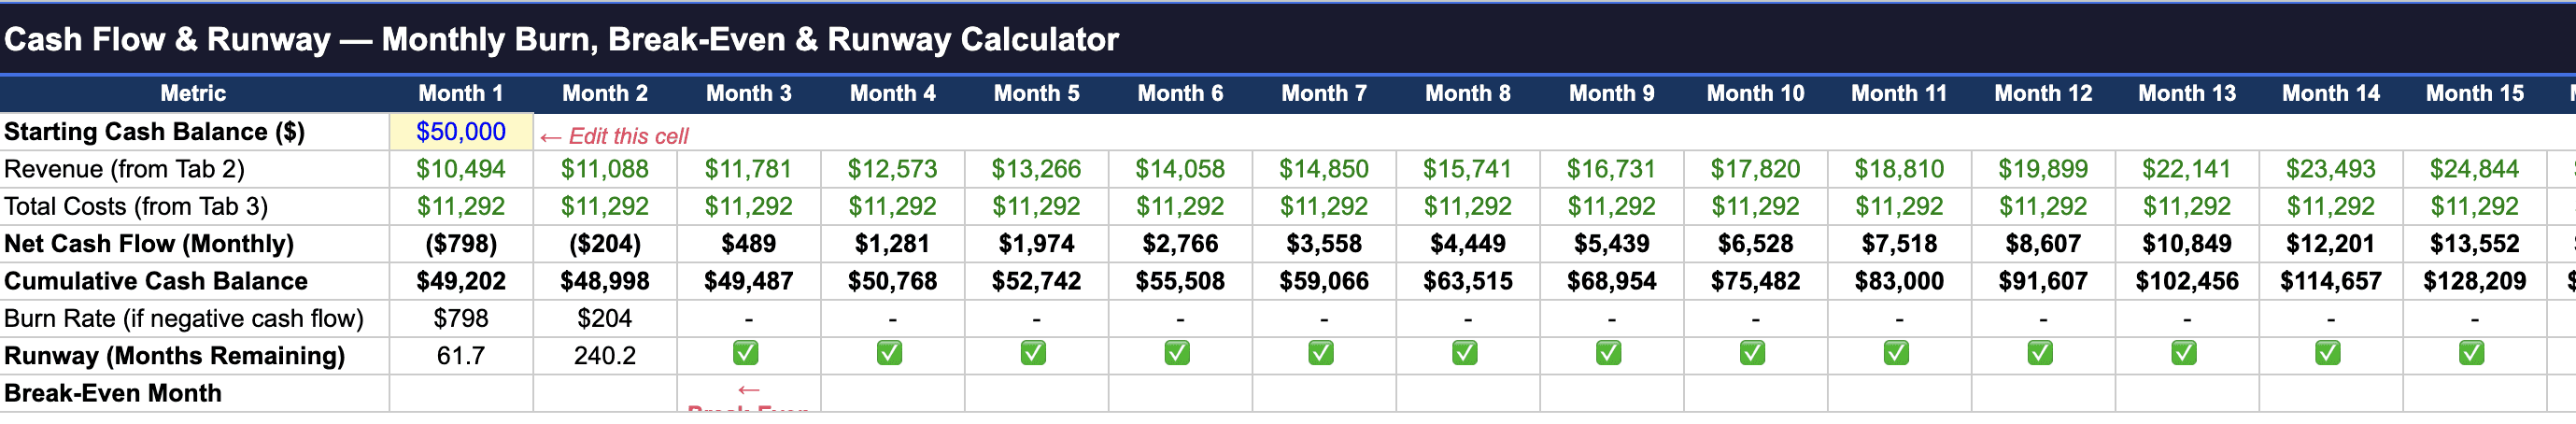
Tab 4: Cash Flow and Runway: Monthly cash tracking, runway calculator, break-even analysis and burn rate tracking.
Tab 5: Scenario Planning: Best, realistic and worst case comparisons with sensitivity analysis.
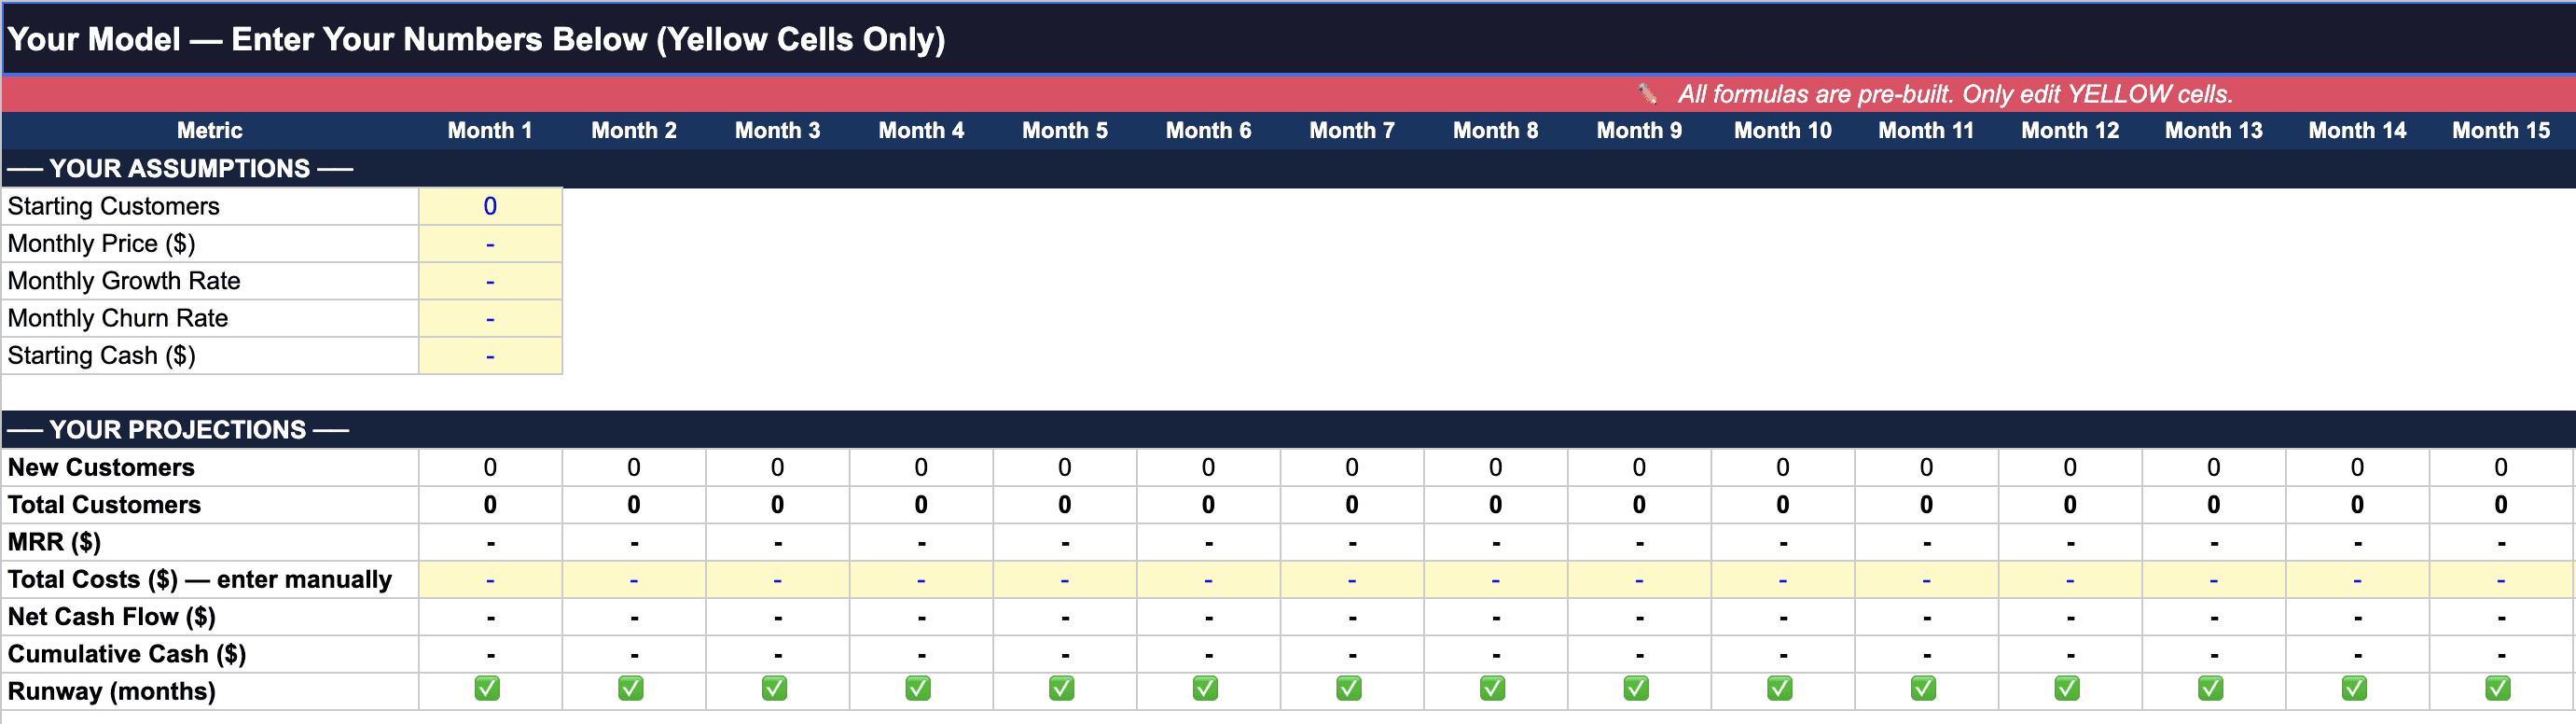
Tab 6: Your Model: Blank template with all formulas pre-built. You fill in your numbers.
Click Here to Download Free Google Sheets financial model (6 tabs) Template
How to use it:
Go to File → Make a copy and save to your Google Drive
Start with Tab 2: Enter your starting customers, monthly price and growth assumptions
Fill in Tab 3: Add your actual costs, separate fixed from variable
Check Tab 4: Enter your starting cash and watch the runway calculate
Review Tab 5: See your three scenarios and make decisions based on worst case
Update it on the first Monday of every month: Takes 15 minutes
Advanced Booted Financial Modeling Techniques
Track Customer Value by Cohort
Cohort analysis means grouping customers by the month they signed up and tracking their retention and revenue over time. It tells you which customers are most valuable and why.
Imagine a January cohort of 20 customers with 80% retention after six months. Your February cohort of 25 customers has 85% retention. The difference? A single onboarding change made between the two months.
That insight, that customers who completed onboarding in the first three days retained at 95% versus 60% for those who didn't, changes where you invest your product time. Cohort analysis shows you this. Nothing else will.
Calculate True Unit Economics
Beyond basic CAC and LTV there are three numbers worth tracking:
Payback period:- How long to recover your CAC. Example: $50 CAC ÷ $139 ARPU = 0.36 months (11 days) Target: Under 12 months
Contribution margin: Revenue per customer minus variable costs. Example: $139 ARPU - $5 variable costs = $134 contribution margin (96%)
CAC ratio:- New MRR divided by sales and marketing spend. Example: $1,390 new MRR ÷ $500 spend = 2.78x Target: Over 1x
An 11-day payback period tells you that you can afford to increase marketing spend significantly without waiting months to see the return. That is the kind of decision unit economics make obvious.
Test Which Variables Matter Most
Sensitivity analysis means changing one variable at a time and watching what happens to your runway and profitability.
For example:
Churn increases from 5% to 10% : runway drops from 14 months to 8 months
Pricing drops from $99 to $79 : you need 25% more customers to break even
Server costs double : profit margin drops from 82% to 74%
The insight: churn had three times more impact on runway than pricing. That tells you where to focus.
Retention over acquisition — at least until churn is under control.
7 Ways to Extend Your Runway
Small cuts compound faster than you think. Here are seven levers worth pulling:
Switch AWS to Cloudflare :- potential saving of $300 a month
Pause paid ads temporarily :- potential saving of $500 a month
Use contractors instead of full-time hires :- potential saving of $2,000 a month
Negotiate annual tool contracts :- potential saving of $150 a month
Delay non-essential features :- potential saving of $3K in dev hours
Offer annual plans for upfront cash :- 10 customers × $1,000 = $10K cash injection
Reduce founder salary temporarily :- potential saving of $4,000 a month
Combined these moves could extend your runway from 4 months to 14 months.
Model every one as a separate scenario so you know exactly what each cut buys you before you make it.
When building Warmcal, Vercel's pricing was quietly draining our budget. Every cron job triggered a charge and checking a scheduling calendar for updates every minute added up fast.
We changed the interval from every 1 minute to every 30 minutes. One configuration change. Costs dropped by more than half overnight.
Nobody told us to do this. The model showed us we had a problem. We went looking for the cause.
5 Financial Modeling Mistakes That Kill Bootstrapped Startups
Mistake 1: Overestimating Revenue Growth
The most common mistake founders make is projecting growth based on optimizm rather than data. A number that feels achievable in month one rarely accounts for seasonality, sales cycles, or the reality that early growth is almost always slower than expected.
Fix: Use a conservative 10% monthly growth assumption as your default. Build seasonal adjustments in from Month 1. Ask yourself honestly, is this projection based on comparable data or wishful thinking?
Mistake 2: Forgetting Hidden Costs
Every startup has costs that don't make it into the first model. Payment processing fees, transaction costs, bank fees, refunds, chargebacks and currency conversion all quietly drain margin before you notice.
Fix: Add a 10% buffer to every cost estimate. You will always find something you missed.
Mistake 3: Tracking Profit Instead of Cash
A model can show profit while the business runs out of cash. This happens when customers pay quarterly or annually, there is a lag between revenue recognized and cash actually received. Profitable on paper but can't pay rent is a real and avoidable situation.
Fix: Model cash flow, not accounting profit. Know exactly when cash arrives, not just when it's earned.
Mistake 4: Copy-Pasting Industry Benchmarks
Using industry averages before you have your own data is dangerous. A single wrong assumption cascades through every projection and makes the entire model unreliable.
Fix: Start with your own data even if it's limited. Update assumptions monthly based on actuals. Don't trust benchmarks until you have product market fit.
Mistake 5: Not Updating the Model Monthly
A model built once and never updated becomes disconnected from reality within weeks. Decisions made on stale projections have no relationship to what's actually happening in the business.
Fix: First Monday of every month update your actuals. Takes 15 minutes. Your model gets more accurate every time you do it.
Is Your Model Wrong? 5 Red Flags:
You haven't updated it in 3+ months
Projected revenue is more than 2x higher than actual
You don't know your current runway
Cost assumptions are over 6 months old
Model shows profit but you're low on cash
Best Tools for Startup Booted Financial Modeling
Tool | Best For | Price | Pros | Cons | Rating |
|---|---|---|---|---|---|
Google Sheets | Getting started | Free | Free, collaborative, templates | Manual updates | ⭐⭐⭐⭐⭐ |
Excel | Advanced formulas | $7/month | Powerful, offline, macros | Paid, not collaborative | ⭐⭐⭐⭐ |
Accounting integration | $30/month | Full accounting, automated | Expensive, complex | ⭐⭐⭐ | |
SaaS metrics tracking | $100/month | Real-time MRR, cohorts | Expensive for early-stage | ⭐⭐⭐⭐ | |
SaaS analytics | $50/month | Great dashboards | Stripe-only | ⭐⭐⭐⭐ | |
Simple tracking | Free-$10/month | Flexible, collaborative | Not built for finance | ⭐⭐⭐ |
What we use at Bugtrotter:
Google Sheets for planning and scenarios: free and flexible
ChartMogul for real-time MRR and churn tracking: $100 a month
Stripe Dashboard for revenue tracking: free with Stripe
We don't use QuickBooks (bit of a overkill right now) or Baremetrics (ChartMogul does more for us).
By stage:
Pre-revenue (Month 0-3): Google Sheets only. Cost: $0
Revenue validation (Month 3-12): Google Sheets + Stripe Dashboard. Cost: $0
Growth stage (Month 12+): Google Sheets + ChartMogul. Cost: $100 a month
Frequently Asked Questions
What is booted financial modeling?
It's a revenue first forecasting method for bootstrapped startups that prioritizes cash flow, profitability and founder control. Instead of modeling for rapid VC-style growth you model for sustainable profitable growth using only customer revenue and founder capital.
How is booted modeling different from VC-driven models?
Bootstrapped models prioritize profitability over growth, focus on cash runway rather than burn rate and aim for 10-30% monthly growth instead of 50-200%. VC models optimize for valuation. Booted models optimize for survival and ownership.
Should I model monthly or annually?
Monthly for the first 12 months then quarterly for years 2-3. Bootstrapped startups need granular cash flow tracking because runway is measured in months not years. Annual projections hide dangerous monthly cash gaps.
How accurate should my projections be?
Within 20% for revenue and within 10% for costs. Revenue projections are harder, we have been off by 30-40% in early months. Costs are easier to predict. Update assumptions monthly to improve accuracy over time.
What if I have $0 revenue today?
Start with a cost-only model. Focus on three questions: How long can you survive? What's your break even customer count? What's your monthly burn? Then add conservative revenue assumptions. Start with one to five new customers a month.
How do I model hiring decisions?
Add a New Hire Scenario in Tab 5. Compare full-time at $5K a month versus contractor at $2K a month. Decision rule: only hire when it extends time to profitability not shortens it.
Should I include founder salary?
Yes even if it's $0 today. Model two scenarios: current ($0 salary) and sustainable ($3-5K a month).
What if my costs are unpredictable?
Use ranges and model worst case. If server costs could be $300-800 a month model $800. If actual is lower you've built in a buffer. Always overestimate costs rather than underestimate them.
How do I model a pricing change?
Create a Pricing Change Scenario in Tab 5. Assume you'll lose 10-20% of customers. Calculate new MRR. At $49 to $99 losing 15% still increases net revenue by 53%. Test with new customers first before changing existing ones.
When should I update my model?
First Monday of every month. Takes 15 minutes. Update actual revenue, actual costs, actual customers and actual churn. Then adjust future projections based on trends. The model gets more useful every month you do this.
Your Turn: Build Your Revenue-Driven Financial Engine
Financial modeling for a bootstrapped startup isn't about perfect predictions. It's about making better decisions with imperfect information.
Our model is a Google Sheet with six tabs. It helped us avoid running out of cash, raise prices increasing revenue, choose contractors over full-time hires extending runway and hit profitability.
Today: Download the template, spend one hour filling in your numbers and check your runway.
This week: Make one decision differently because of what you see. Set a calendar reminder for the first Monday of next month.
This month: Compare actual versus projected, adjust your assumptions and plan the next three months based on worst case scenario.
Questions about the template or your model? Email me: hello@bugtrotter.com
View more articles
Learn actionable strategies, proven workflows, and tips from experts to help your product thrive.